Resistivity IP
Email us: consultant@seisxploregeosurvey.com or phone/WA: +62 821 7211 1561
Resistivity data is usually interpreted by modeling either 1-D, 2-D or 3-D. The 1-D modeling stage usually starts from the subsurface model hypothesis from the initial model. The resistivity value response is calculated and compared with the instrument reading. The initial earth model hypothesis is then adjusted to approach the instrument reading value (which has been corrected). Validation of this value is not necessarily done in one process, sometimes it must be done several times (iterative process) so that the optimum value is obtained (iterative inversion).
For 2-D Capitalization, the measurement results obtained through vertical and horizontal mapping are refined by addressing error data or validating them against topographic data. The final validated results undergo a modelling process (involving data calculation and observation) to achieve the optimal value through iterative inversion. Crucial factors for obtaining the optimal value include thorough data collection, the use of tools that are accurately calibrated for the local environment, and implementing quality control throughout the measurement process. After a suitable optimal value is reached through inversion, a 2-D cross-section is produced, which can then be analyzed along the measurement path. The inversion results are further validated by comparing them with calibrated data and reference materials to support rock classification, stratigraphic analysis, and other evaluations.
A commonly used approach for 3-D modeling of geoelectric data involves using a flat 2-D model as input. While this method is widely applied, it is scientifically flawed because it does not account for topographic data. As a result, the accuracy of depth, stratigraphy thickness, and reserve estimates can be compromised, making the model difficult to justify.
The next step in 3-D modeling involves differentiating the range of values obtained from field calibration and reference data, so that the inverted 2-D data can be used to create a 3-D solid model that includes topographic information. This model has both advantages and drawbacks for reserve calculations. If the track spacing does not align with the model, wider spacing will increase the interpolation value for each track. However, tighter track spacing improves the accuracy of the reserve calculations, resulting in more precise outcomes.
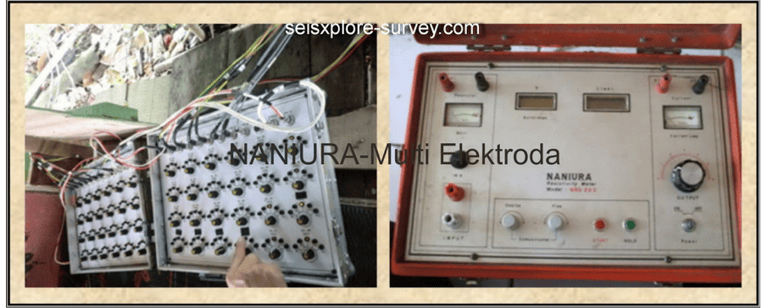
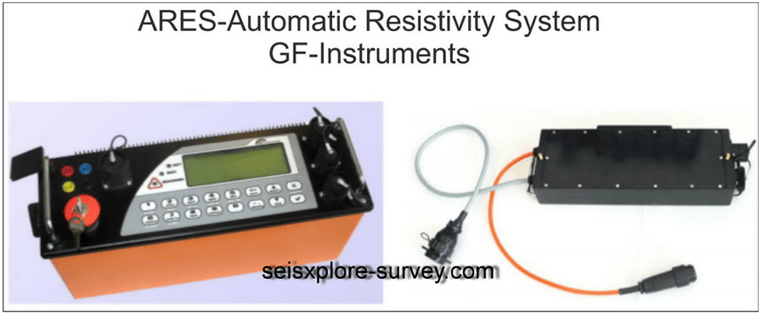
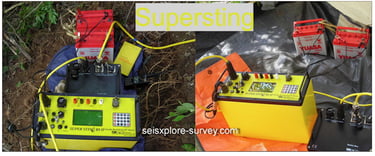
We offer geoelectric and IP survey services, including 3-D modeling to estimate reserves based on geoelectric or IP data. This involves combining interpretations from various data sources to enhance the accuracy of total reserve estimates. Additionally, we rent out resistivity-IP equipment such as Naniura, Ares, Supersting, and Zonge, along with qualified operators or specialists.
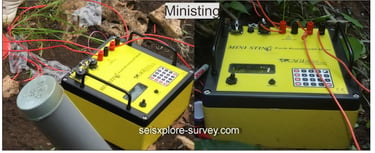
Our resistivity IP instruments for rental:




Some of our Geoelectric and IP survey experiences:
Coal Exploration
Mineral Exploration:
Manganese
Iron Ore

Tin
Nickel / laterite
Iron sand
Gold
Water source search
Subsurface geology:
Landslide area
Bedrock
Underground space (void space)
Excavation C
Andesite and Volcanic
Excavation C, or multiple excavation explorations, are conducted in materials such as limestone, volcanic/andesite, or sand sediments. This technique is commonly used to determine the lateral and vertical distribution of andesite or volcanic rocks. Its effectiveness in identifying these distributions is particularly valuable due to the large size of the rocks, as well as their higher compactness and smaller pore spaces compared to sedimentary rocks.
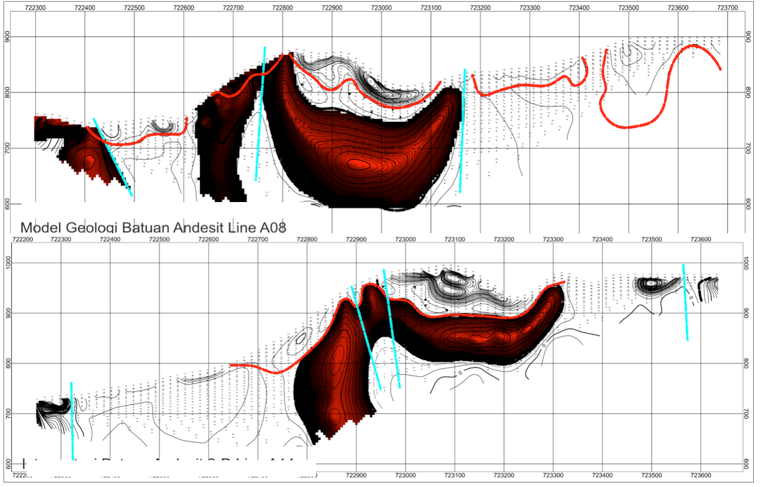

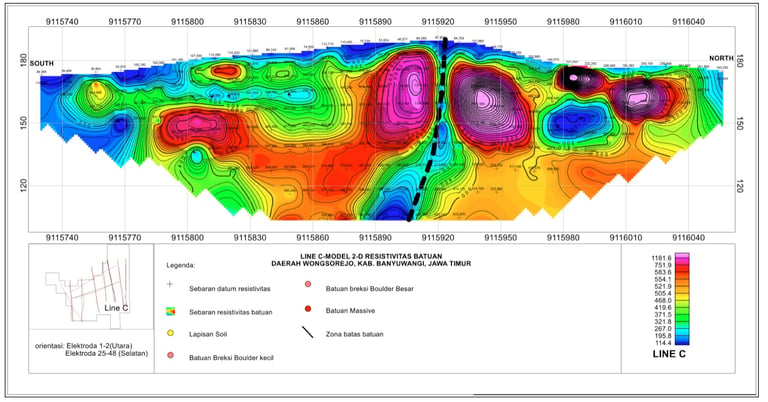

Figure 3. Andesite Model
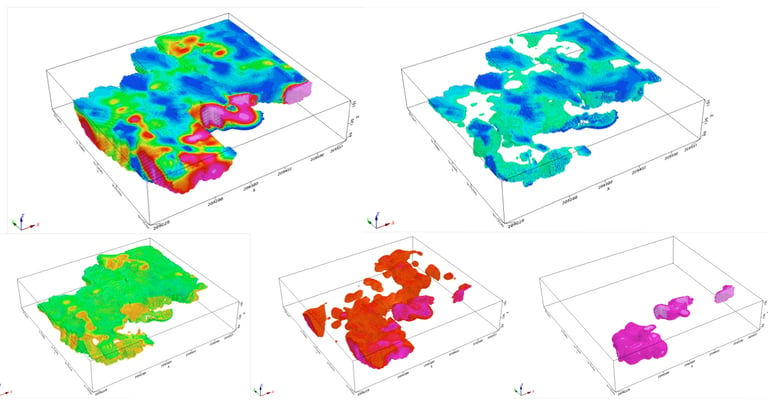

Figure 4. Volumetric of target
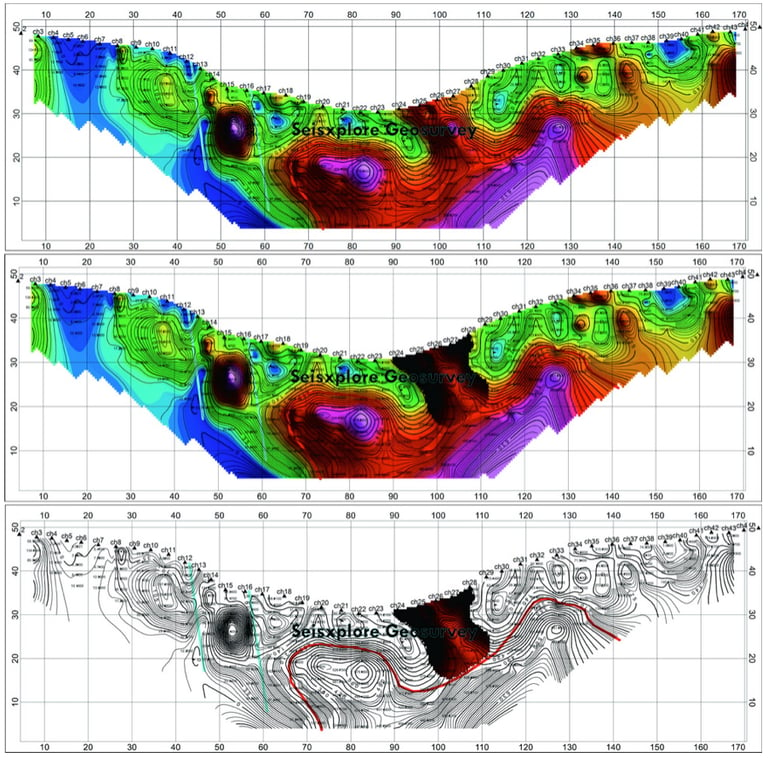
Figure 1. Resistivity 2D model (Iron Ore).
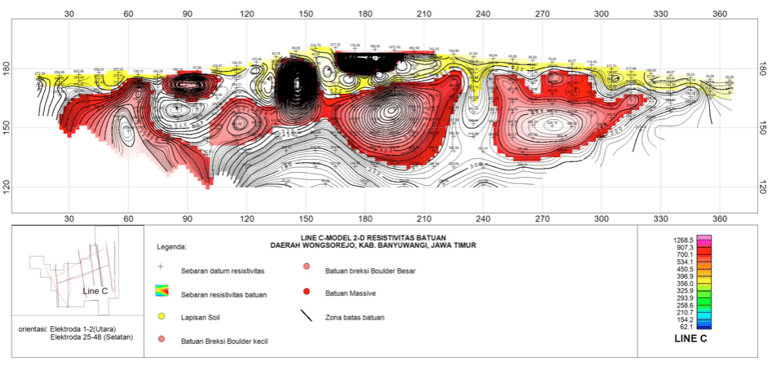

Figure 2. Resistivity 2D model (Gold).
