Latest Project
Identification of cavities in Kepulauan Tanimbar. (October 2024)
Our team has just completed our project in the Kepulauan Tanimbar. The objective of this project was to identify cavities for potential drilling, which can later serve as a guide for future construction. Below are some key conclusions from our microgravity survey:
The identification of voids/cavities during the initial drilling was based solely on the visual observation of the drill string’s faster downward movement, without any additional verification method.
Diagraphy drilling continuously records five (5) parameters during the drilling process. The results indicate no voids or cavities up to a depth of 30 meters at several locations.
The microgravity data was processed using a 3D modeling technique, incorporating the recorded diagraphy drilling parameters as calibration values.
The microgravity surveys conducted in the test area were validated by data from the diagraphy drilling.
The microgravity survey in the main area is expected to yield reliable data for detecting potential cavities.
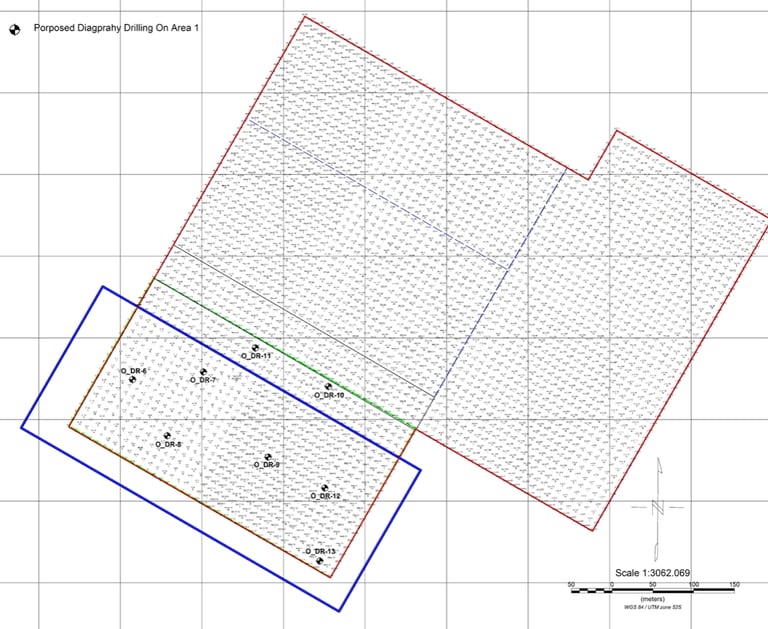

Figure 1. Microgravity survey area and proposed diagraphy drilling on area 1 (marked with the blue reactangle).
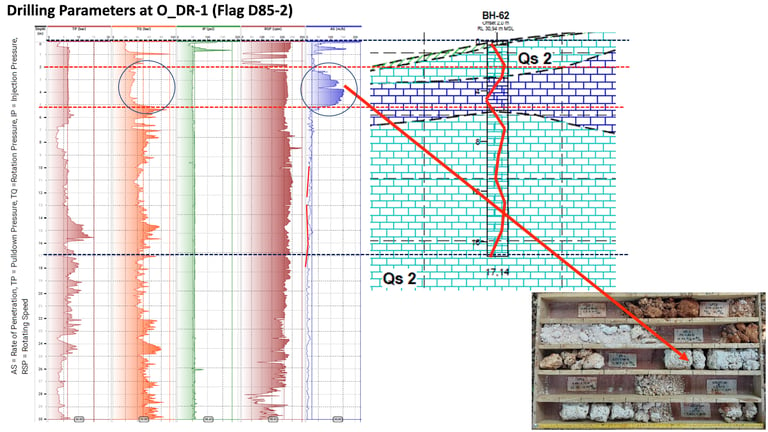

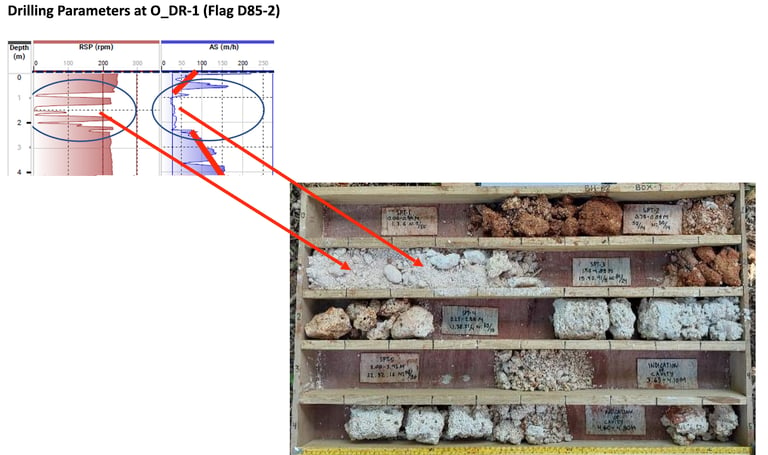

Figure 2. Drilling parameters at O_DR.
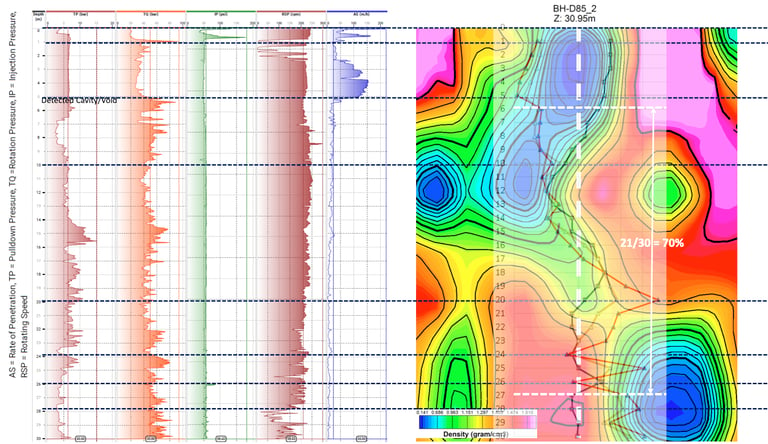

Figure 3. Correlation between drilling data and microgravity data.
Groundwater Exploration
Geoelectric survey to find groundwater in Central Kalimantan. (January 2025)
The geoelectric cross-section is done by inverting apparent resistivity data obtained from the field. The length of each track is around 0 to 500 meters with electrode spacing of around 10 meters. The length of the span and the electrode spacing of 10 meters adjust to the target of around 90 meters to 100 meters.
The soil or rock resistivity value recorded along a 500-meter and a depth of up to 90 meters has a range of values of around 0 to 1000 ohm.m, but the average maximum value at each point is still below 500 ohm.m. The water content in the soil that correlates with the resistivity value is below the range of 100 ohm.m but in the calculation of reserves only the range value of around 0 to 30 ohm.m is used.
The water content in the soil in volumetric cubic meters has a gross content value that includes the surrounding material content, such as sand, silt, clay flakes and others in the form of porous materials. The water volume content is calculated at around 50% of the total volume of material from the range of 0 to 30 ohm.m with the consideration that the value of 30 ohm.m contains quite a lot of water with a minimum water content of around 50%.
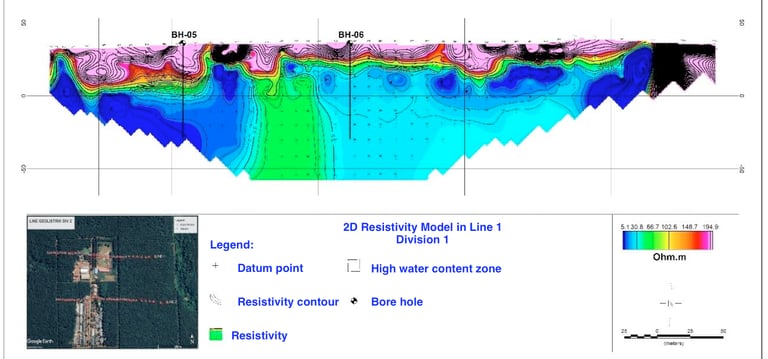

Figure 1. Interpretation for water content in Division 2.
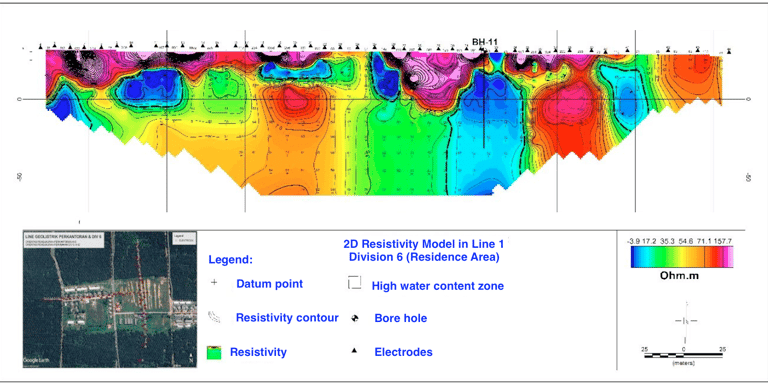

Figure 2. Interpretation for water content in Division 6 (Residence Area).
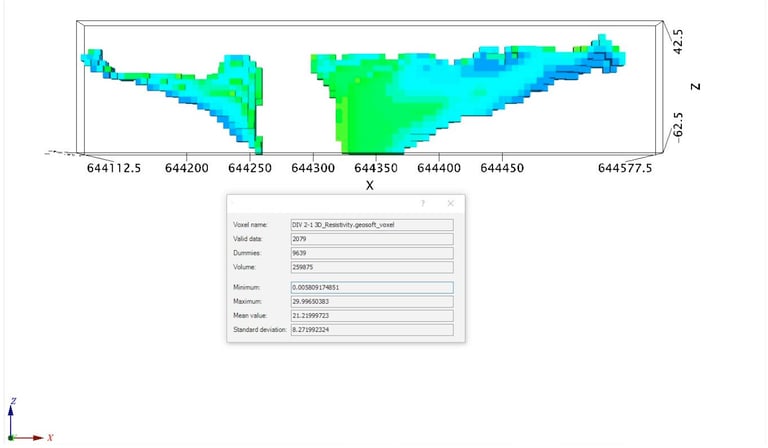

Figure 3. Volumetric calculation of water in soil at Division 2.
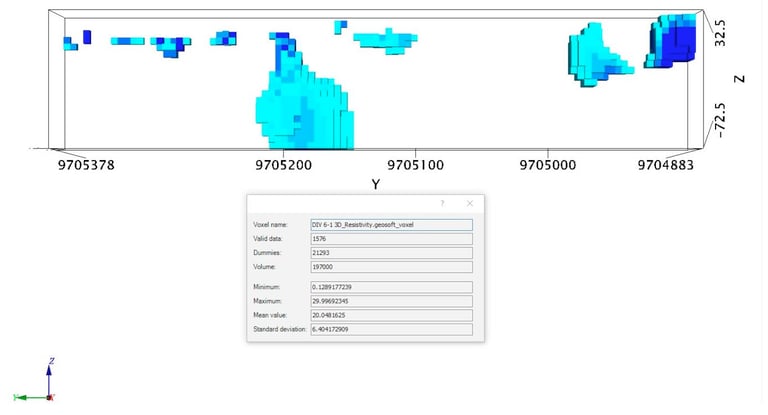

Figure 4. Volumetric calculation of water in soil at Division 6.
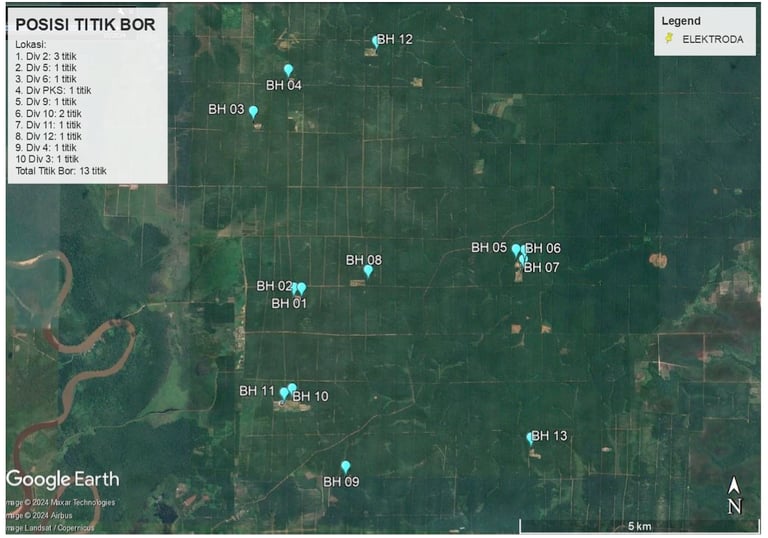

Figure 5. Thirteen bore hole recommendation in each division.
